Global Base Commodities Markets Closely Follow The Global Economic Scenario
June 2023 Commodities Market Outlook.
The professionals who track and work in the commodities markets need to be an ardent student of global economics and geopolitics. Global economic scenario over the last 2 months have been volatile and importantly are seeing diverse kinds of bearish signals as compared to the previous 3-6 months. Weak economic signals from China and other major economies with India being the only bright spot globally, interest rate hikes due to persisting inflation across major economies globally, no signs of any end to the Russia – Ukraine war, political battles in the USA over the debt ceiling and an impending ugly election cycle have played truant. Any hope and light at the end of the tunnel was seen with some recent stimulus measures from China with interest rate cuts. All mixed indicators from the economic front have been mirrored in the commodities markets.
Recent Commodity Selloff Due To Weak Global Economic Scenario
Commodity prices saw a selloff in early May`23 with global funds pulling out of the commodities markets as reflection of the global economic conditions. Major product prices corrected by 5-20% as a part of this sell off.
Interest rate movements too has been mixed across the major economies which has led to a hazy outlook for the commodity markets. US Fed are hinting at being at the fag end of the interest rate hikes, ECB has indicated more hikes to fight inflation and China is on a rate cut mode to stimulate the economy. In this background, fund movements across the commodity sectors have been affected.
Global economic outlook looks bleak with four of the top economies facing economic headwinds. US, despite strong services sector and jobs data, is constrained by high interest rates with inflation still hovering at 4.5-5%. Germany, the largest economy in the European, has entered recession with high inflation rates of plus 6%. Thereby forcing the ECB to increase interest rates and hence choking growth. Another key factor for EU, is the gas prices movements for this year`s winter season and the pricing dynamics in the background of the Russia -Ukraine war.
Indian market has been firm with inflation under control and the RBI signalling that interest rate hikes might be at its end.
| Products | Marker | UOM | Q1 23 | April 23 | May 23 | H1 June 23 | June 23 (H1) vs April 23 |
| Oil | Brent | $/bbl | 81.2 | 84.9 | 75.6 | 75.3 | -11% |
| Gas | JKM | $/mmBTU | 16.4 | 12.1 | 9.8 | 9.4 | -22% |
| Iron ore | 62% CFR China | $/MT | 125 | 116 | 105 | 112 | -4% |
| Thermal Coal | NewCastle 5500 NAR | $/MT | 127 | 121 | 113 | 89 | -26% |
| Aluminum | LIME | $/MT | 2,436 | 2,341 | 2,267 | 2,209 | -6% |
| Copper | LIME | $/MT | 8,943 | 8,813 | 8,234 | 8,325 | -6% |
Supply side issues have been overshadowed by the demand weakness
With the existing weak economic scenario the supply side issues seem to have a limited influence on the market dynamics. The shocking crude oil supply cut in early June 23 by OPEC by ~ 1 million bbl /day, hasn’t lent any strength to the oil prices. In fact Brent crude oil prices have moved down to $72/bbl levels by mid June`23 as compared to ~ $75/bbl levels in early June 23.
Similarly, the ~ 1.5 MMTA aluminium output cut in China`s Yunnan province, due to power shortages, hasn’t added any firmness to the aluminium markets.
Soft Chinese economic performance has affected markets, but stimulus measures have added some positivity
China carries a great heft in the commodity market movements. Weak Chinese economic performance since February`23 has played truant in the commodity market movements.
Chinese NBS manufacturing PMI came in at 48.8 in May`23 as compared to 49.2 in April`23. As manufacturing accounts for a considerable proportion of the Chinese GDP, lacklustre manufacturing performance has kept the Chinese GDP under check. Exports and imports growth have degrown by 7.8% in May`23 from 14.8% in April`23 while imports have shown a 7.9% degrowth on a YOY basis. Strangely, despite the inflationary trends globally China has an inflation of 0.1% only as compared to inflation rates of 4.5% in India and USA and 7% + in Europe!! Housing market is still lacklustre with Q2`23, new home sales in 30 large cities falling to 75% of the 2019 level as compared to 90% in Q1`23.
However, the Chinese government has given signals of priming the economy. The reverse repo rate was cut last week to boost lending with signals of more cuts and more stimulus for the property market. This has resulted in perking up a few of the commodity segments linked to the infrastructure and property markets with the benchmark iron ore prices, on a CFR China prices, hovering around $115/MT as compared to ~ $100/MT in early June`23. Whether this mini rally is sustainable is something that needs to be watched for.
| Indicators | UoM | Feb-23 | Mar-23 | Apr-23 | May-23 |
| NBS Manufacturing PMI | 52.6 | 51.9 | 49.2 | 48.8 | |
| NBS Production Index | 56.7 | 54.6 | 50.2 | 49.6 | |
| NBS Non Manufacturing PMI | 56.3 | 58.2 | 56.4 | 54.5 | |
| NBS Comprehensive PMI | 56.4 | 57 | 54.4 | 52.9 | |
| Caixin Mfg PMI Final | 51.6 | 50 | 49.5 | 50.9 | |
| Industrial Production (YoY growth) | % | 2.4 | 3.9 | 5.6 | 3.5 |
| Real Estate Investment (YoY Growth) | % | -5.1 | -5.1 | -5.3 | 6 |
| Fixed Asset Investment Growth (YoY) | % | 5.5 | 5.1 | 4.7 | 4 |
| M2 Money Supply (YoY) | % | 12.6 | 12.9 | 12.7 | 12.4 |
Currency movements, dictated by the interest rate movements will play a role in the commodity prices
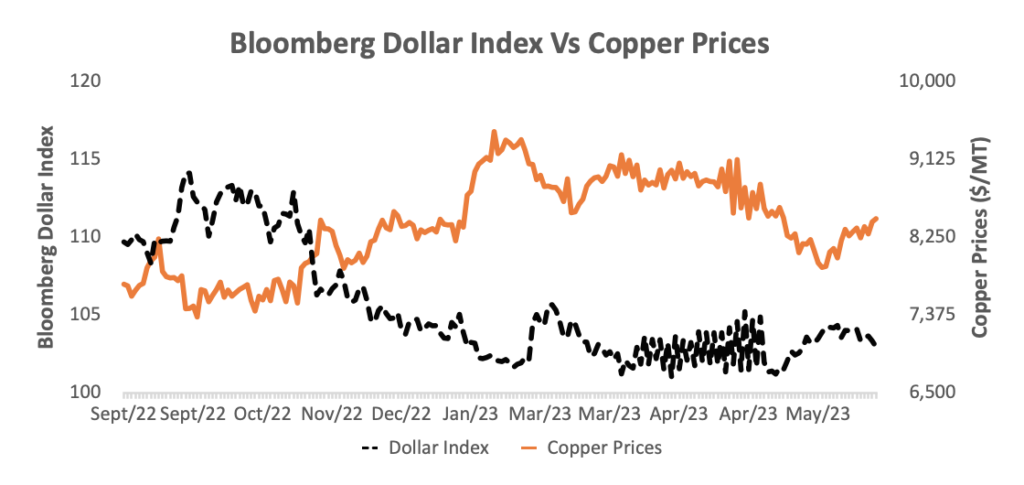
Commodity prices normally move inversely to the US$. Bloomberg dollar index, which remained firm in the range of 102- 104 driven by the interest rate hike cycle. In the last 2 days, the Fed has indicated some more rate hikes in the next few months as compared to earlier estimates of rate cuts by Q4`23.
US dollar index remained firm even during the debt ceiling crisis in May`23. In the current weak economic scenario and expectations of some more rate hikes, the US Dollar is expected to remain firm and hence pressurizing the commodity prices in US$ terms.
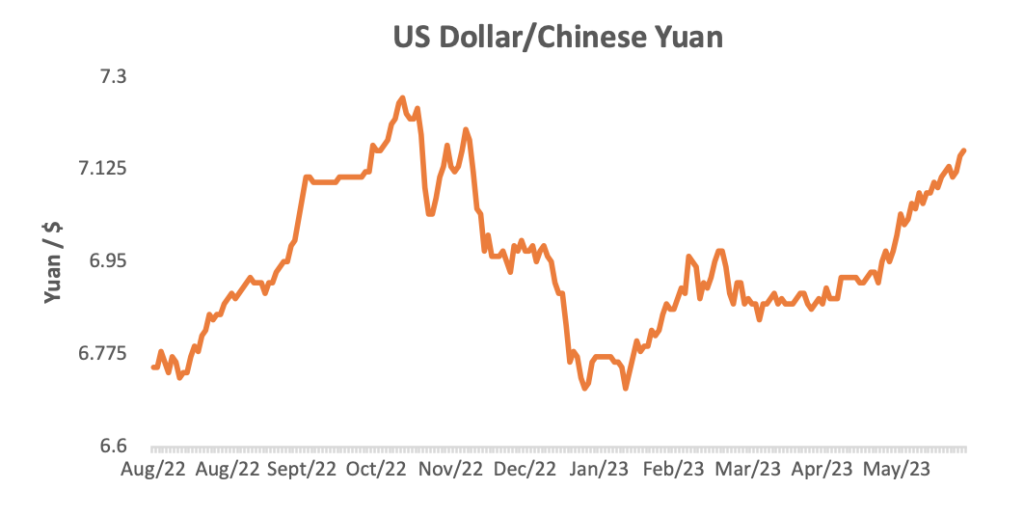
Importantly, the Chinese Yuan too has depreciated by 3.5% from April`23 which makes the imported commodity prices more expensive in local currency terms as against the domestic supplies. Hence there will be a pricing pressure on the commodity prices in US$ terms till the Chinese currency starts appreciating again. China can be expected to keep its currency weak to boost its exports and hence discourage any major currency appreciation which too can put pressure on commodity prices in US$ terms.
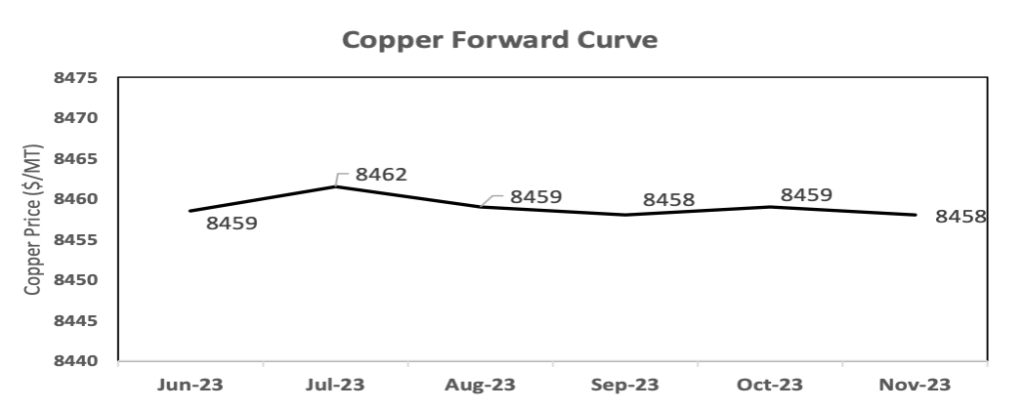
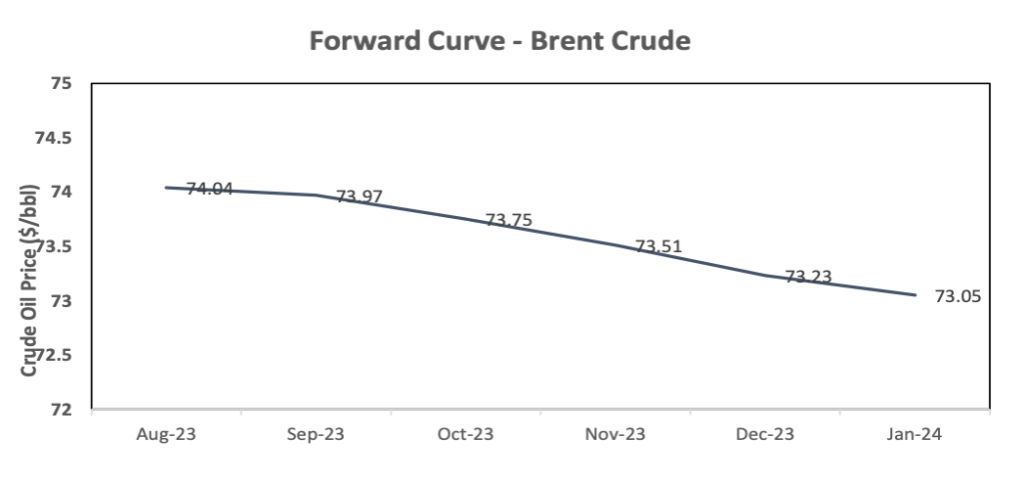
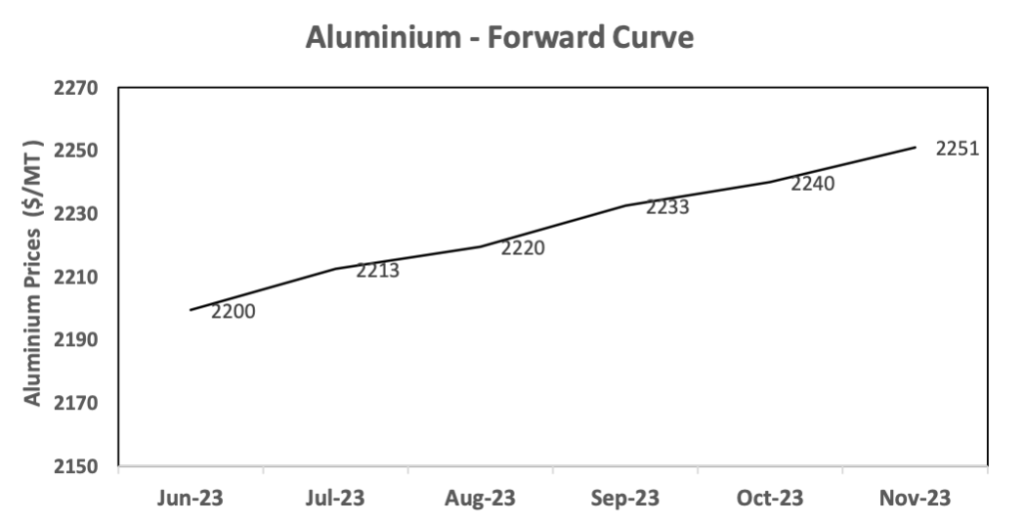
Forward Curves of major commodities don’t show a major upside
In a normal market scenario, the forward curves of the major commodities should be in contango reflecting the interest rates. Despite high interest rates, many of the curves are flat too backward dated reflecting a soft outlook.
What’s the outlook for commodity prices? Seems bearish but positive indicators can be seen now
Demand dynamics will play a key role in the commodity price movements over the next 3-6 months. Present economic headwinds from the global economic scenario can keep commodity prices under control in the short term. Even though supply chain economics, as displayed in the oil output cut recently, will have a lesser role in the price outlook as compared to demand dynamics, any supply disruption can lead to an increase in commodity prices.
Major driver for any upside in commodity prices will be the stimulus package from China which can stoke demand in China especially in the infrastructure and property markets. The recent stimulus packages have kindled hope of a revival as can be seen recently in the strength in iron ore prices and increase in the steel production rate in China. In the longer term, demand growth from the ecosystem evolving electric vehicles and battery storage, infrastructure demand from developing nations and supply chain issues in mining can lead to firmness in commodity prices.
To summarize, despite short term weakness at present, macro-economic factors will lead to commodities being a critical part of any investment portfolio.